Our Approach


Infusion Revenue Cycle Analytics Built Around the Questions You’re Already Asking.

Your data already contains the answers. SolisRx connects the sources, identifies root causes, quantifies the financial stakes, and builds the monitoring infrastructure that keeps those answers current.
SolisRx combines operational depth, data engineering skills, and infusion domain expertise.

Infusion data analytics require a unique combination of skills

Between your EHR, clearinghouse, billing system, CRM and bunch of spreadsheets, the data that could answer leadership’s critical questions already exists. It may not be connected in a way that surfaces answers at the speed decisions require.

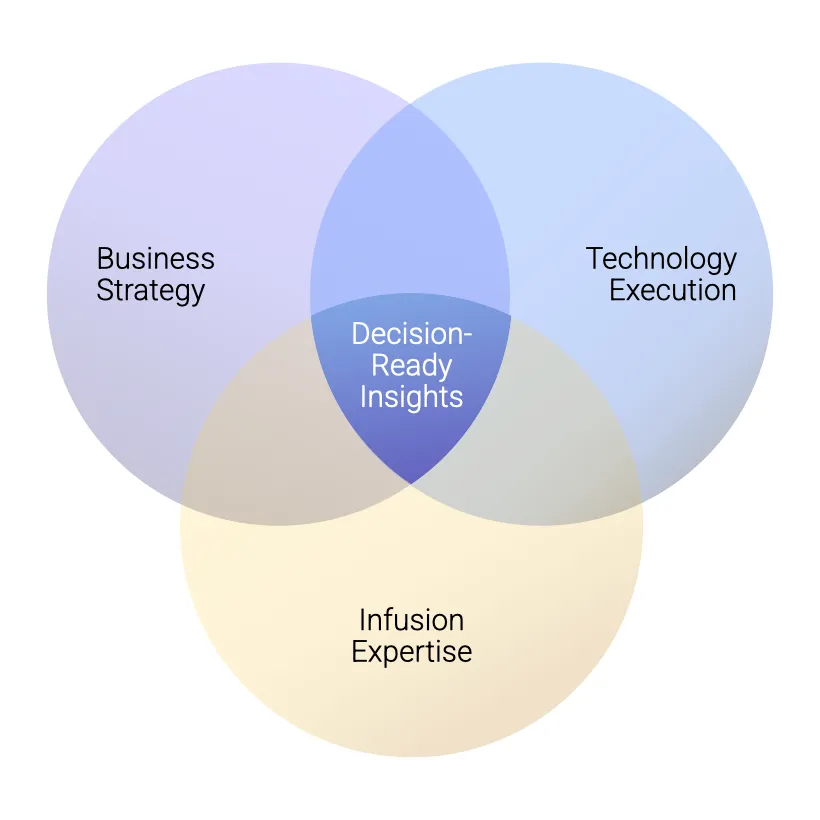
The gap isn’t technology but a combination of three things that internal and most external teams can rarely bring together: operational depth to ask the right questions, data engineering skill to connect the sources reliably, and infusion domain expertise to interpret what the numbers actually mean. Without all three, you get dashboards nobody can act on. That intersection is where SolisRx works.

Our Methodology

Transparent glass panels with digital analytics graphs and charts in an office setting.
Start with the business question
Not a general request to “improve the revenue cycle”, but a specific management question with quantified financial impact. Collections are down 12 percent at two sites. Authorization denials spiked last quarter. Referral volume dropped from a key physician group. The question defines what data connections are needed and what analysis will be meaningful.
Connect the data spinE
SolisRx integrates the relevant data sources into a unified view, from claims to clearinghouse, remittance, EHR, referral tracking, and where needed, third-party data. This connectivity requires pulling data together, governing it correctly, and using AI/ML tools to surface patterns rather than individual records.
Identify the root causE
Not the symptom. One engagement revealed that a Medicare Advantage plan had quietly updated its IVIG documentation requirements, denying 35 percent of claims at two sites under the old workflow. The aggregate number said “collections are down.” The root cause analysis said exactly why and exactly where.
Quantify the financial impact
Every finding comes with a dollar figure. That IVIG documentation issue: $180,000 in denied claims at risk of write-off, plus $55,000 in rework-driven billing delays. A concrete number enables leaders to prioritize remediation for maximum impact on revenue or margin.
Build the monitoring artifact
After remediation, SolisRx builds a standing exception report (for example, a pre-submission check flagging non-compliant IVIG claims before they go out). What was a reactive problem becomes a proactive process. When that payer changes its rules again, the system catches the first non-compliant claim, not the 40th.
Map showing multiple locations of an infusion provider.

The Right Fit

SolisRx works with multi-site ambulatory infusion centers, home infusion providers, specialty pharmacies, and specialty care practices with a  topline revenue of over $30M. At that scale, denial patterns become multifactorial, cross-site variation becomes meaningful, and the cost of not seeing across the business grows faster than the business itself.

Start With a Conversation About Your Organization’s Specific Gaps

Most engagements begin with a focused diagnostic: a two-to-three-week analysis of a specific question your leadership team already has. The diagnostic produces a root cause finding and a dollar quantification. It also leaves you with a roadmap for addressing the core issues along with an estimate of the effort required, and the expected ROI and payback.
Launch Plan Builder
Need help customizing?
Loonis Logo
More Templates