Revenue Cycle Management (RCM) is complex and plagued by siloed systems that make it difficult to access and integrate critical data. Providers frequently struggle with delayed payments, high denial rates, and inefficient workflows that limit cash flow and impact financial stability. To stay competitive, practice managers need solutions that break down these barriers and deliver actionable insights to tackle their unique challenges.The ability to consolidate data from disparate systems into a single, unified view is no longer optional—it's essential. Access to real-time insights enables providers to track key performance indicators (KPIs), identify high-risk accounts, and make data-driven decisions to optimize operations. Whether it's resolving claim denials or improving collections performance, having the right tools can make all the difference.
Dashboards tailored to Your Unique Practice Needs
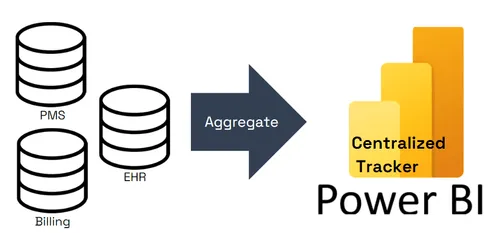
At SolisRx, we understand the challenges healthcare providers face. That’s why our Power BI dashboards are tailored to solve your practice's specific business problems. Whether it’s accelerating collections, reducing denials, or improving operational workflows, we create solutions tailored to your goals. Below, you’ll find examples, using sample data, of reports and metrics we’ve developed. These can be customized for your organization and delivered in just a matter of weeks.
Use the Arrows to Explore Each Page
Read below for a description of the data, key metrics, and the value generated on each page of the dashboard.
Executive Dashboard: Track Your RCM KPIs in Real Time
Executive Dashboard provides a comprehensive view of your organization’s financial health, tracking essential RCM metrics like:
- Days in Accounts Receivable (A/R): Understand payment delays and improve cash flow.
- Aged > 90 Days: Identify high-risk accounts requiring immediate attention.
- Denial Rate: Pinpoint causes of claim denials to minimize revenue loss.
- Collections Rate: Compare your performance against targets to drive improvement.
This real-time RCM dashboard features dynamic filters for Payor Type, Payor Name, and Service Date, ensuring you can focus on the insights most relevant to your operations.
Accounts Receivable Dashboard: Manage Your A/R Effectively
The A/R Dashboard offers a detailed breakdown of your accounts receivable, helping you prioritize efforts and reduce outstanding balances:
- Aging Categories: Understand payment delays and improve cash flow.
- Collections Rate by Payer: Identify high-risk accounts requiring immediate attention.
- Claims Volume Trends: Pinpoint causes of claim denials to minimize revenue loss.
This interactive A/R analytics tool equips healthcare providers to reduce AR Days, strengthen financial stability and optimize operations.
Denials Dashboard: Reduce and Resolve Claim Denials
The Denials Dashboard enables your team to take proactive measures against claim denials:
- Denial Trends: Visualize denial rates by payer and time period.
- Overturn Success: Measure overturn rates by claim volume and dollar value.
- Resolution Times: Track average and maximum time-to-resolution metrics.
This Denials report arms your team to understand where denied claims are originating, resubmit existing denials, and implement new workflows to reduce denials from occuring in the first place.
RCM Waterfall Dashboard: Monitor Payment Trends Over Time
The Revenue Cycle Waterfall Report uses powerful visualizations to highlight financial performance trends:
- Net Collection Rate: Understand how well your practice is collecting on what you are contractually owed after accounting for contractual adjustments, write-offs, and other non-collectible amounts.
- BIlling Velocity: Understand how quickly new charges are being posted after encounters occurred
- Charge Velocity: Understand how quickly your practice is getting paid
This Customizable Waterfall Report for RCM surfaces differences in Dates of Services vs Posting date, across Revenue, Adjustments, and Payments to give your practice a clear picture into opportunities to accelerate cashflow and boost revenue. complete transparency and provides actionable insights to boost your financial outcomes.