


Most infusion organizations are sitting on more data than they realize. Patient records, referral logs, authorization histories, claims files, remit data, scheduling records: it all exists. How much value all that data creates for the business is a different question entirely.
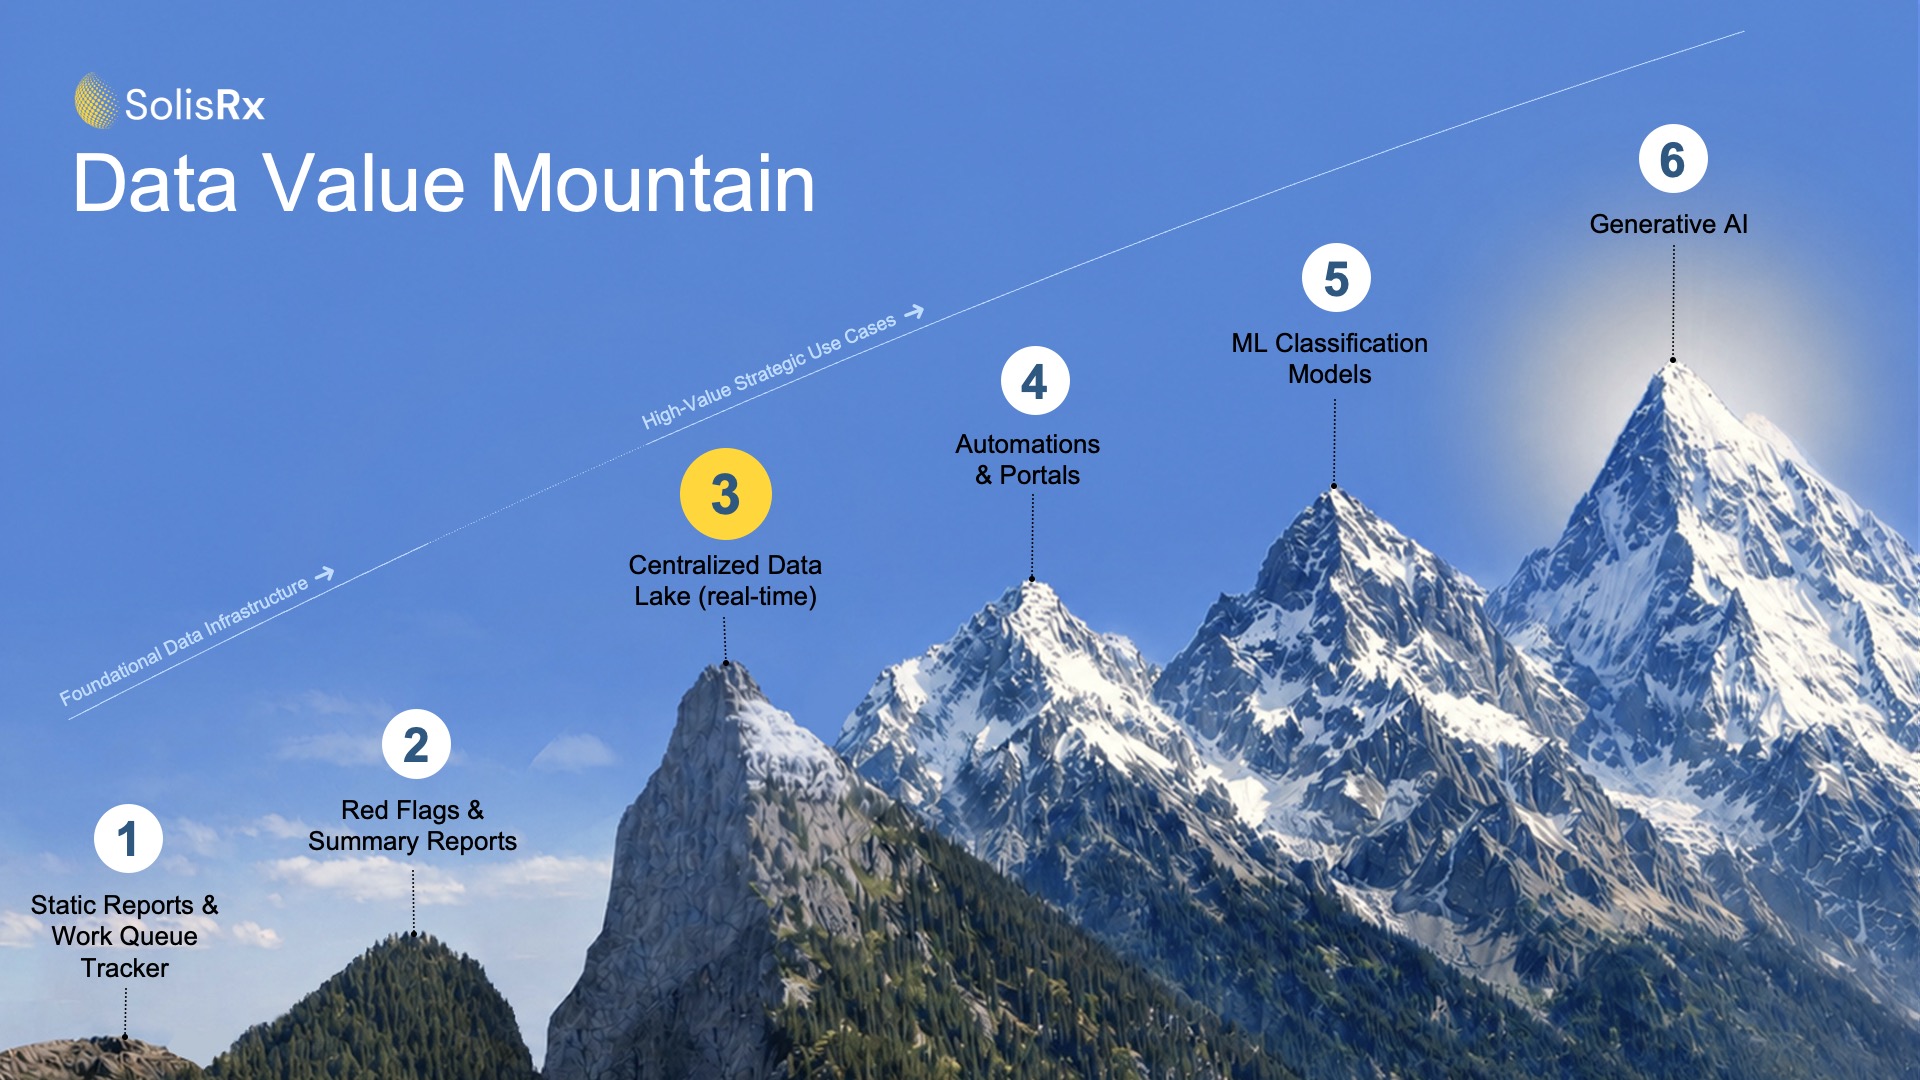
SolisRx Data Value Mountain is a six-step framework mapping the journey from disconnected, static reports to predictive, AI-powered operations. Each step represents a meaningfully different capability level, and a meaningfully different competitive position. Understanding where your organization sits is the first step to knowing what's genuinely within reach.
Base Camp: Where Most Operators Are (Steps 1 and 2)
Roughly 80% of infusion organizations are still in the lower reaches of the mountain.
Step 1 is static reporting: work queue trackers, manually compiled spreadsheets, and reports pulled when someone asks a question. They're useful for basic operational awareness, but labor-intensive, perpetually out of date, and limited to the questions someone thought to ask in the first place.
Step 2 represents real progress through automated summary reports and flag reports generated by Point Solutions on a batch schedule. Most organizations at this level have decent visibility within individual systems. The limitation is that each system reports on itself. Your billing platform shows billing data. Your scheduling system shows scheduling data. Real intelligence lives in the connections between those systems, and at Step 2, those connections don't yet exist.
Rising Above the Treeline: The Data Lake (Step 3)
Step 3 is the most consequential transition on the mountain, and where the Data Spine concept becomes tangible.
Building a data lake means creating a centralized environment that pulls from every system in your operation, including your EHR, billing platform, clearinghouse, intake tracker and CRM system, and unifies it at a near-real-time cadence. Each of your systems holds a fragment of the patient and revenue journey. The data lake connects those fragments into a single chain: Sales Activity, Referral, Order, Appointment, Claim, Payment, Bank Deposit. You can query across that entire chain rather than being limited to what any single system can show you.
The shift in operational visibility is dramatic. At Step 2, you can see your denial rate. At Step 3, you can see that your denial rate for IVIG claims through a specific payer has spiked 15 points this quarter, trace it back to three referring providers with incomplete Prior Authorization documentation, and quantify the dollar impact. That is the difference between reporting and diagnostics. Powerful executive dashboards, referral source performance analysis, authorization pipeline monitoring, and cross-site benchmarking all become possible here. The mountain gets interesting at Step 3.
Automation That Runs While You Sleep (Step 4)
With a solid data foundation beneath it, workflow automation becomes reliable and scalable.
Step 4 is where organizations start recovering hours, not just insights. Common use cases in infusion include automated fax ingestion and referral routing, insurance eligibility verification, appointment reminders, Provider Portals and Manufacturer Portals (think Dominoes Pizza Trackers!), follow-up message sequences, claim status polling from payer portals, and payment posting from remit files. These workflows are typically powered by Robotic Process Automation (RPA), with Optical Character Recognition (OCR) handling document-heavy tasks.
The key distinction at Step 4 is that automation follows defined rules and scales consistently, without requiring human judgment on every transaction. A clean, connected data foundation is the prerequisite for this to work reliably, since automation scales whatever process it is applied to, efficient or otherwise.
Pattern Recognition at Scale (Step 5)
Machine Learning (ML) models have been in production in healthcare for more than a decade. They are well-tested, low-risk relative to newer AI technologies, and delivering significant financial impact at organizations with the foundation to deploy them.
In infusion, the highest-value applications include:
Denial prediction
Scoring pre-submission claims by denial probability, then multiplying by contract amount to produce a "dollars at risk" figure that fundamentally changes prioritization. Organizations using this approach have reduced initial denial rates by approximately 25%. Nearly 90% of denials are considered avoidable with the right preventive tooling in place.
Provider churn detection
Referral volume in infusion typically follows an 80/20 pattern, with a small number of referring providers driving the majority of new patient starts. A single disengaged high-value prescriber can create a revenue gap that takes months to identify and longer to recover. ML-based provider churn models monitor referral frequency, drug mix, and behavioral patterns at the individual provider level, surfacing early signals of disengagement in time for sales and relationship teams to intervene before the relationship moves to a competitor.
Referral conversion prediction
Industry benchmarks suggest 25% to 35% of referrals fail to convert to a completed infusion due to authorization delays, patient drop-off, or intake bottlenecks. ML models can score incoming referrals by their dollar value and probability of conversion based on payer, therapy type, and prior authorization complexity, allowing intake teams to direct attention toward the referrals most at risk of falling through.
Payment timing forecasting
Payer payment timelines vary significantly and are often difficult to predict from experience alone. ML models trained on historical remittance data can forecast expected payment timing by payer and claim type, giving finance teams a more reliable basis for cash flow planning and revenue projections.
The Summit: Generative AI in Production (Step 6)
Step 6 is where the tools generating the most excitement, and the most scrutiny, live.
Reaching this step meaningfully requires everything beneath it. The data lake at Step 3 provides the connected, trusted data that Generative AI (GenAI) tools need to process documents accurately and write outputs back into the right downstream systems. The automation layer at Step 4 ensures that workflows are defined clearly enough for AI to operate within them reliably. The ML foundation at Step 5 establishes the performance benchmarking infrastructure needed to evaluate whether GenAI tools are actually delivering on their claims. Without those layers in place, GenAI adoption tends to produce impressive pilots and inconsistent production results.
The V3 (Verification, Validation, Value) Framework, published by SolisRx CEO Chris Hilger on the NICA (National Infusion Center Association) website, provides a practical structure for exactly that. Before deploying any GenAI platform, ask three questions: Can I verify the task was actually completed as specified? Can I audit how the output was generated? And can I measure return on investment on a fully loaded basis, accounting for token costs, configuration time, compliance overhead, and rework? The operators who can answer all three questions with confidence are the ones who built their data foundation first.
Where Are You on the Mountain?
If you're unsure where your organization sits today, that's worth figuring out before your next technology decision. SolisRx works with infusion operators to assess current data maturity, identify the most valuable next step, and build the infrastructure that makes every step above it possible.